Quick start
Basic example
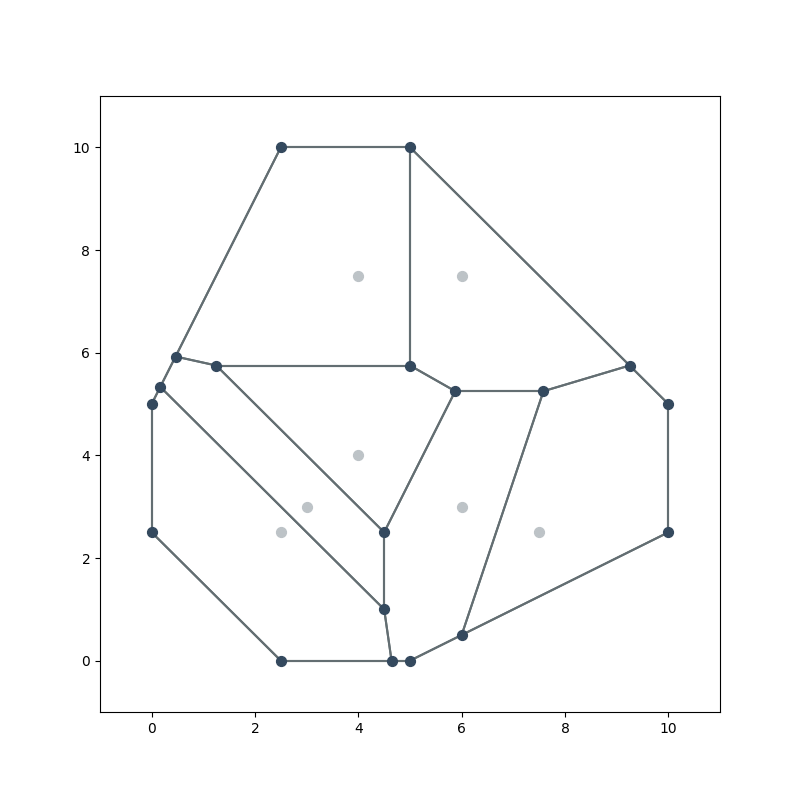
This is a basic example that quickly constructs and visualizes a voronoi graph.
from foronoi import Voronoi, Polygon, Visualizer, Point, VoronoiObserver
from foronoi.graph import HalfEdge, Vertex

# Define some points (a.k.a sites or cell points)
points = [
    (2.5, 2.5), (4, 7.5), (7.5, 2.5), (6, 7.5), (4, 4), (3, 3), (6, 3)
]

# Define a bounding box / polygon
polygon = Polygon([
    (2.5, 10), (5, 10), (10, 5), (10, 2.5), (5, 0), (2.5, 0), (0, 2.5), (0, 5)
])

# Initialize the algorithm
v = Voronoi(polygon)

# Optional: visualize the voronoi diagram at every step.
# You can find more information in the observers.py example file
# v.attach_observer(
#     VoronoiObserver()
# )

# Create the Voronoi diagram
v.create_diagram(points=points)

# Visualize the Voronoi diagram
Visualizer(v) \
    .plot_sites(show_labels=False) \
    .plot_edges(show_labels=False) \
    .plot_vertices() \
    .show()
Result:
Properties
Below are some examples of how to retrieve certain components and properties from the voronoi graph and what kind of operations are possible.
from typing import List

# Some examples of how to access properties from the Voronoi diagram:
edges: List[HalfEdge] = v.edges                    # A list of all edges
vertices: List[Vertex] = v.vertices                # A list of all vertices
sites: List[Point] = v.sites                       # A list of all cell points (a.k.a. sites)

edge, vertex, site = edges[0], vertices[0], sites[0]

# Edge operations
origin: Vertex = edge.origin               # The vertex in which the edge originates
target: Vertex = edge.twin.origin          # The twin is the edge that goes in the other direction
target_alt: Vertex = edge.target           # Same as above, but more convenient
twin: HalfEdge = edge.twin                 # Get the twin of this edge
next_edge: HalfEdge = edge.next            # Get the next edge
prev_edge: HalfEdge = edge.twin.next       # Get the previous edge
prev_alt: HalfEdge = edge.prev             # Same as above, but more convenient

# Site operations
size: float = site.area()                  # The area of the cell
borders: List[HalfEdge] = site.borders()   # A list of all the borders that surround this cell point
vertices: List[Vertex] = site.vertices()   # A list of all the vertices around this cell point
site_x: float = site.x                     # X-coordinate of the site
site_xy: [float, float] = site.xy          # (x, y)-coordinates of the site
first_edge: HalfEdge = site.first_edge     # Points to the first edge that is part of the border around the site

# Vertex operations
connected_edges: List[HalfEdge] = vertex.connected_edges  # A list of all edges that are connected to this vertex
vertex_x: float = vertex.x                                # x-coordinate of the vertex
vertex_xy: [float, float] = vertex.xy                     # (x, y)-coordinates of the vertex
Observers
Observers allow you to observe the state of the algorithm and visualize components during the construction of the voronoi graph. Below you can see an example where we attach an observer that visualizes the voronoi graph at every step (event).
import os

from foronoi import Polygon, Voronoi, VoronoiObserver
from foronoi.visualization import Presets

# Define some points (a.k.a sites or cell points)
points = [
    (2.5, 2.5), (4, 7.5), (7.5, 2.5), (6, 7.5), (4, 4), (3, 3), (6, 3)
]

# Define a bounding box / polygon
polygon = Polygon([
    (2.5, 10), (5, 10), (10, 5), (10, 2.5), (5, 0), (2.5, 0), (0, 2.5), (0, 5)
])

# Initialize the algorithm
v = Voronoi(polygon)

# Attach a Voronoi observer that visualizes the Voronoi diagram every step
v.attach_observer(
    VoronoiObserver(

        # Settings to pass into the visualizer's plot_all() method.
        # - By default, the observer uses a set of minimalistic presets
        #   that are useful for visualizing during construction, clipping
        #   and the final result.
        # - The settings below will update the default presets used by the
        #   observer. For example, by default, the arc_labels are not shown,
        #   but below we can enable the arc labels. Other parameters can be
        #   found in the visualizer's plot_all() method.
        settings=dict(arc_labels=True, site_labels=True),

        # Callback that saves the figure every step
        # If no callback is provided, it will simply display the figure in
        # a matplotlib window
        callback=lambda observer, figure: figure.savefig(
            f"output/voronoi/{observer.n_messages:02d}.png"
        ),

        visualize_steps=True            # Default = True
        visualize_before_clipping=True  # Default = False
        visualize_result=True           # Default = True
    )
)

# Create the output directory if it doesn't exist
if not os.path.exists("output"):
    os.mkdir("output")

if not os.path.exists("output/voronoi/"):
    os.mkdir("output/voronoi/")

# Create the Voronoi diagram
v.create_diagram(points=points)
Slideshow of images in output/voronoi/: